The system has an extensive module of reports and analyzes related to the assessment of subjective well-being and fatigue of players. To go to reports and analyzes, click on the left menu in diary fatigue analysis reports .
Preparing a report requires defining several parameters. At the top of the page, select: what kind of analysis you want to report, what group of players you want to include in the report. It can be the whole team, the selected group or a single player. The last step is to define the time period to be taken into the report. Remember that you have to confirm each change in the report settings with the pink button "generate report".
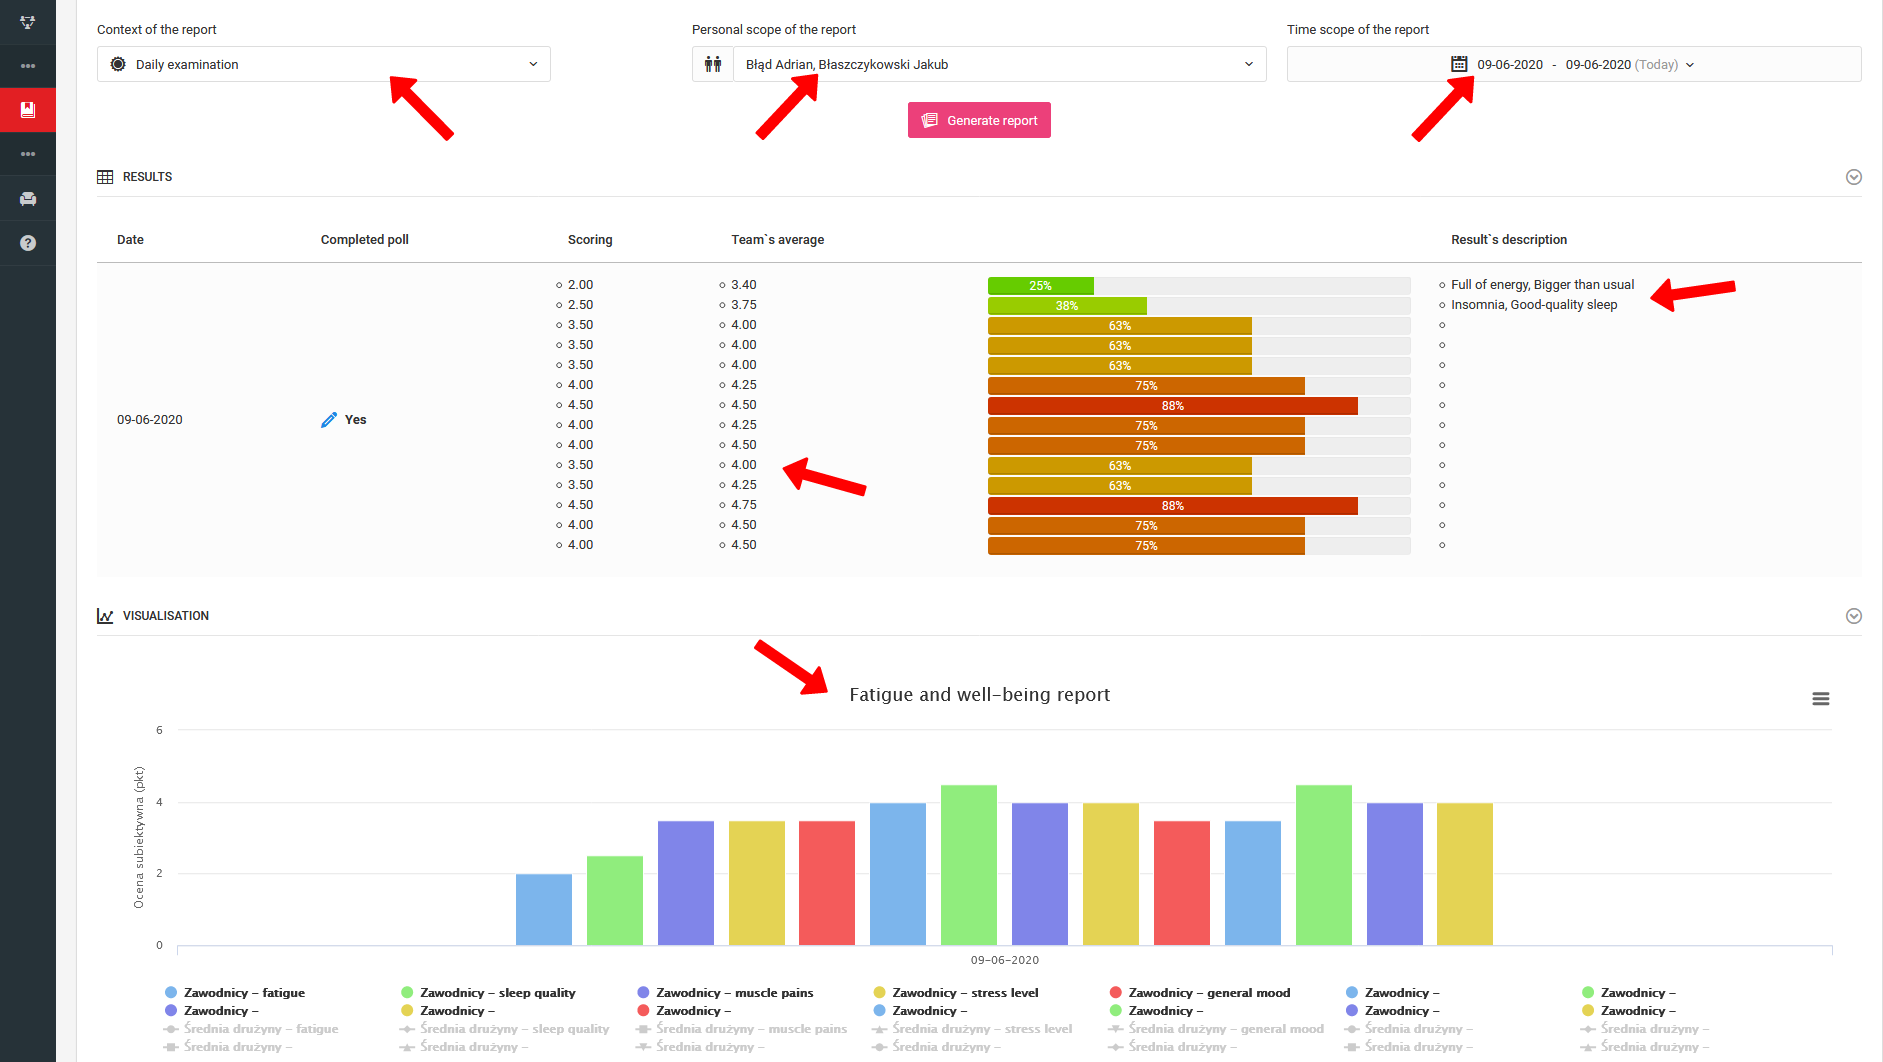
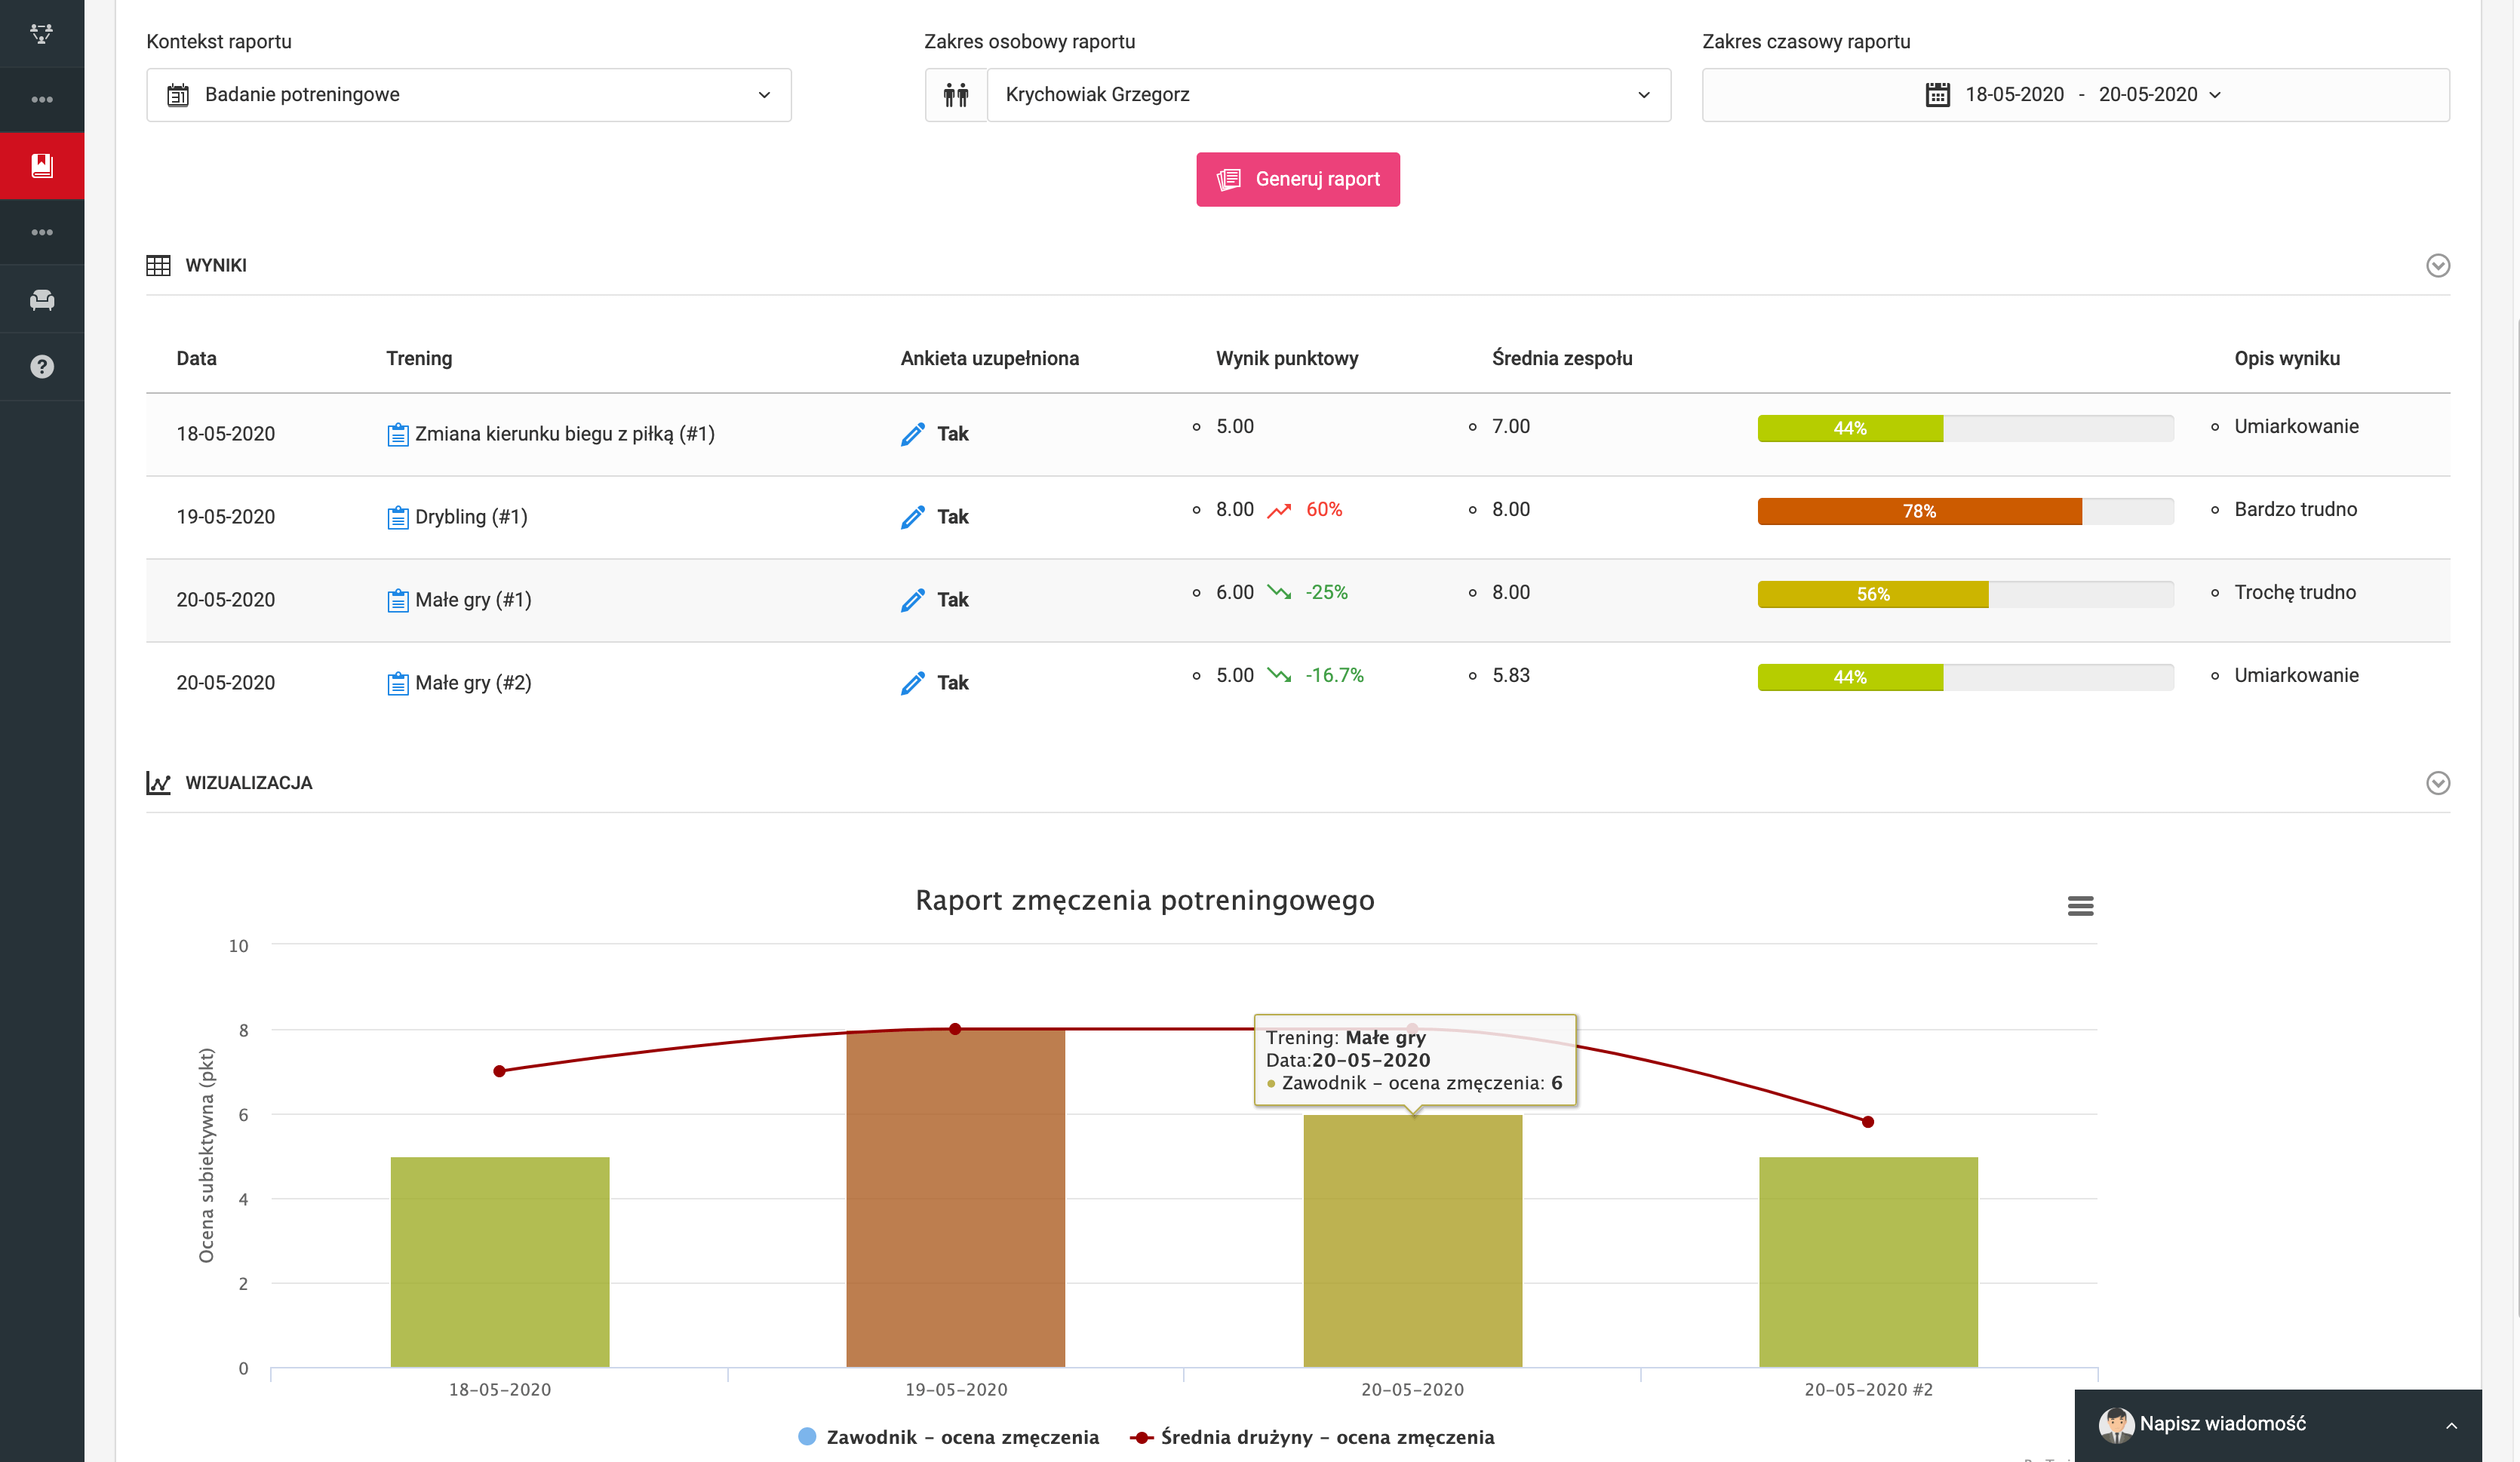
In the prepared graphics you can see two types of research reporting - daily team research and individual post-training.
The results presented in the reports provide you with an analysis of both unitary, per each measurement (day, workout, match) and collective statements in the form of graphs aggregating data on one timeline. Moreover, the analysis will show the percentage change of results compared to the last survey and the dominant response among players.
In the case of individual results you are able to compare the results of a player to the average of the whole team. The chart is generated dynamically and its range will change as the parameters of the whole report change. You can save each chart to a jpg or png file and download it on your computer. The player and the parent have access to the results of their charges. There is no place in the system where he can compare his results with those of his teammates.
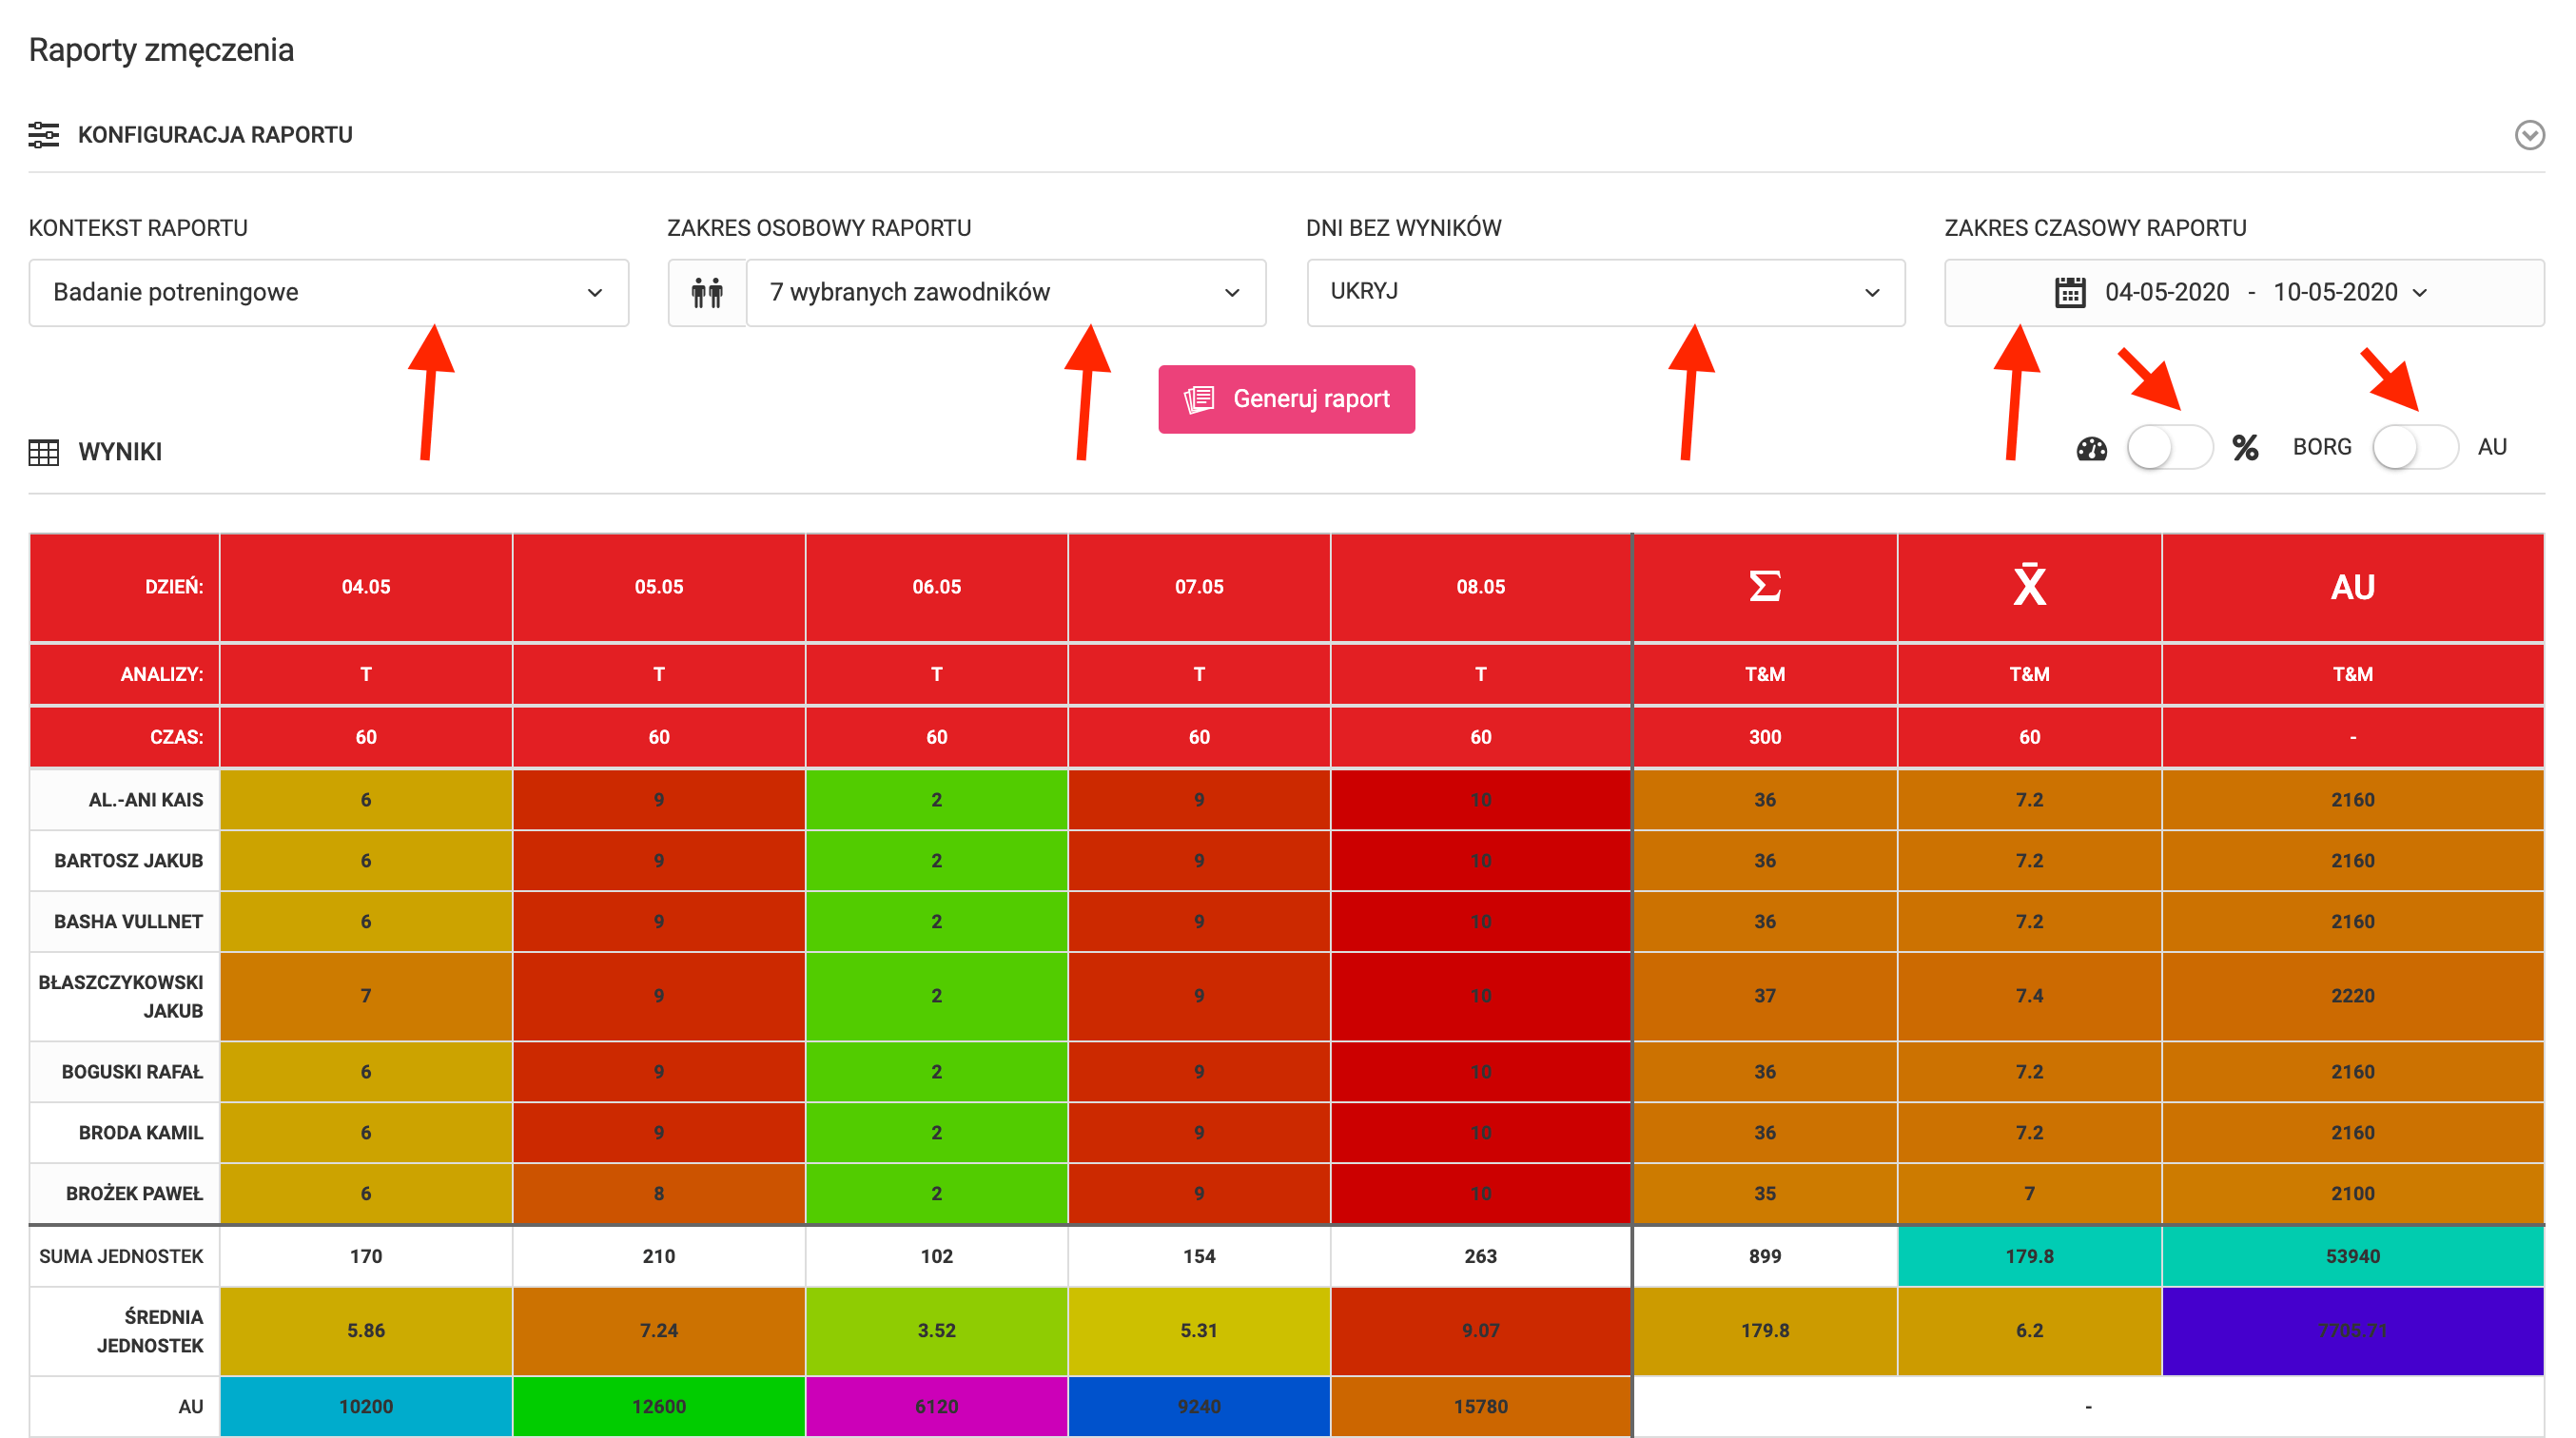
A summary report is also available in the system, showing a very wide range of data with analyses. Above the report table, there is a configurator available. As in the case of detailed reports, you can choose what type of studies should appear in the table. You can select which players are to be included in the report, mark the time range of the report and also hide days without measurements. On the right-hand side above the table, you have two sliders that affect the way data is presented. The first one is responsible for changing the way the results are calculated - you can choose a numerical or a percentage value. In the second slider, you determine whether the data is to be presented as a scale value or as calculated fatigue units (AU). Remember to confirm each change in the report configuration and analysis with the pink "generate report" button.